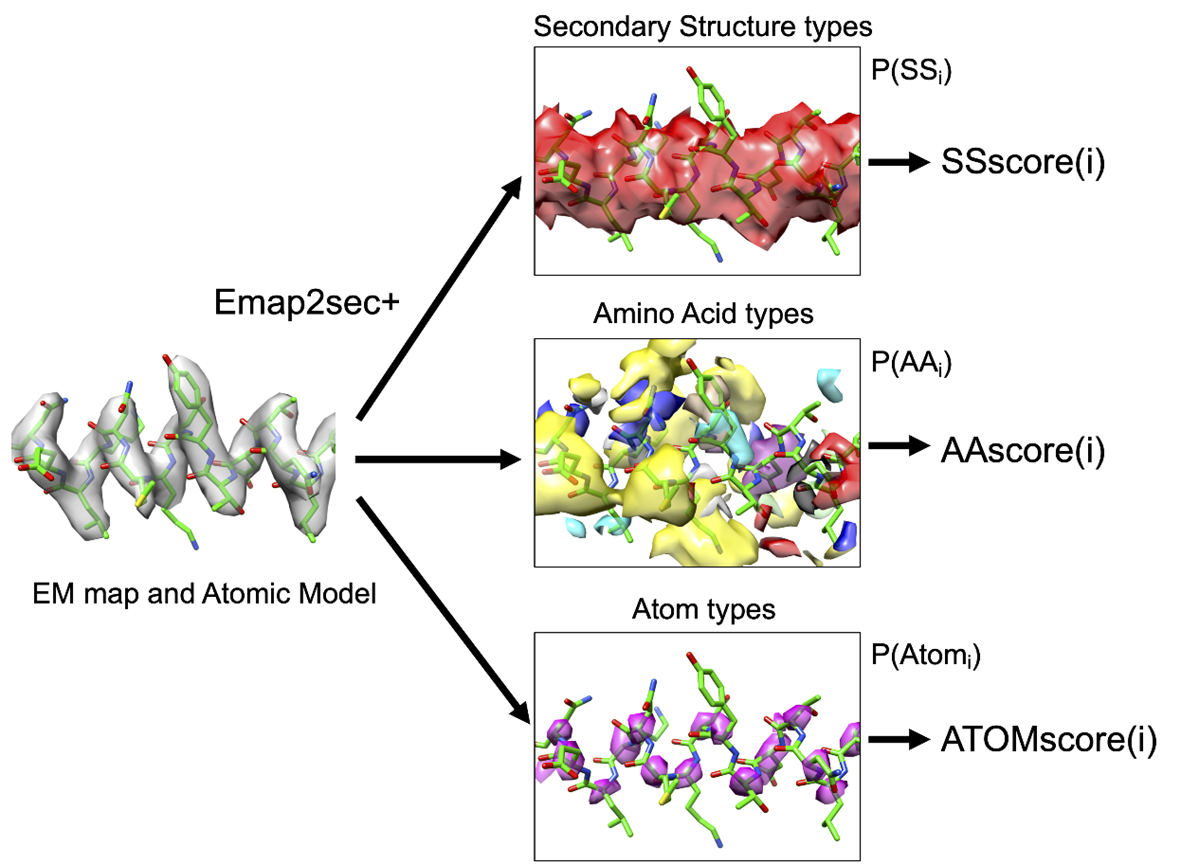
DAQ uses deep-learning and computes the likelihood that each local position in a cryo-EM map corresponds to different secondary structures, amino acids, and Cα atoms from its local density features.
Then, a plausibility of each residue in a structure model from the cryo-EM map is quantified with the following equations.
The amino acid type of residue \(i\) in a model is evaluated as:
\[
DAQ(AA)(i)=log\left(\frac{P_{aa(i)}(i)}{\sum_{j}P_{aa(i)}(j)/N}\right),
\]
where \(aa(i)\) is the amino acid type of residue \(i\), \(P_{aa(i)}(i)\) is the computed probability for the amino acid type of residue \(i\) by deep learning, which is normalized by the average probability of the amino acid type across over all atom positions in the protein model.
The Cα position of residue \(i\) in a model is evaluated as:
\[
DAQ(C\alpha)(i)=log\left(\frac{P_{C\alpha}(i)}{\sum_{j}P_{C\alpha}(j)/N}\right),
\]
where \(C\alpha(i)\) is the Cα atom of residue \(i\), \(P_{C\alpha}(i)\) is the computed probability that the position correspond to a Cα atom by deep learning, which is normalized by the average probability of Cα over all atom positions in the protein model.
Lastly, the secondary structure of residue \(i\) in a model is evaluated as:
\[
DAQ(SS)\left(i\right)=\sum_{ss\in H,E,C}{{Pseq}_{ss}\left(i\right)log\left(\frac{P_{ss}\left(i\right)}{\sum_{j}P_{ss}(j)/N}\right)},
\]
where \(SS(i)\) is the secondary structure type of residue \(i\) to be evaluated, \({Pseq}_{ss}(i)\) is the probability of the secondary structure \(ss\) for the amino acid residue \(i\) predicted from the protein sequence using a secondary structure prediction method, SPOT1D. \(P_{ss}(i)\) is the computed probability of the secondary structure of residue \(i\) by the deep learning, which is normalized by the average probability of the secondary structure type across over all atom positions in the protein model.
Computed scores are averaged over a window of 19 residues along the sequence, because this averaging better distinguished potential incorrect and correct residue placements in the benchmark.