How to use the DAQ-Score Database
- Entry Search
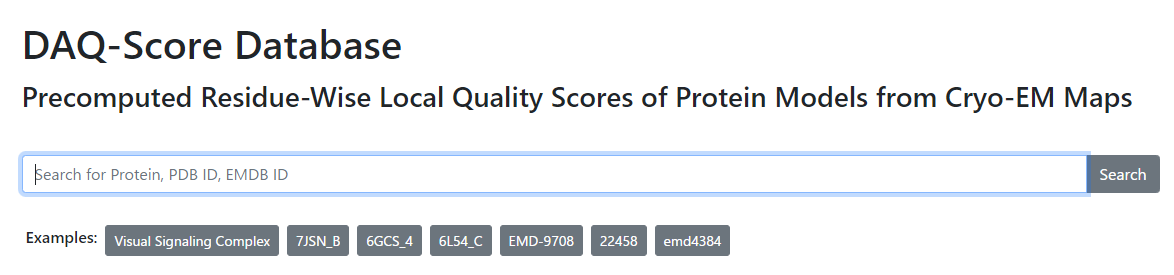
From the top page, entries can be searched by text, PDB ID, and EMDB ID. Users can search across entries by entering a text in the search bar and pressing the search button. When normal text is entered, a fuzzy search is performed against titles of the PDB structures powered by Elasticsearch. If PDB ID or EMDB ID is entered, an exact match is performed. (A word starting with EMD-/emd-/EMD/emd and followed by digits or consisting of only digits is treated as EMDB ID. Partial match against PDB ID or EMDB ID is not considered.)
The thumbnails of all entries can be seen from here.
- Entry View
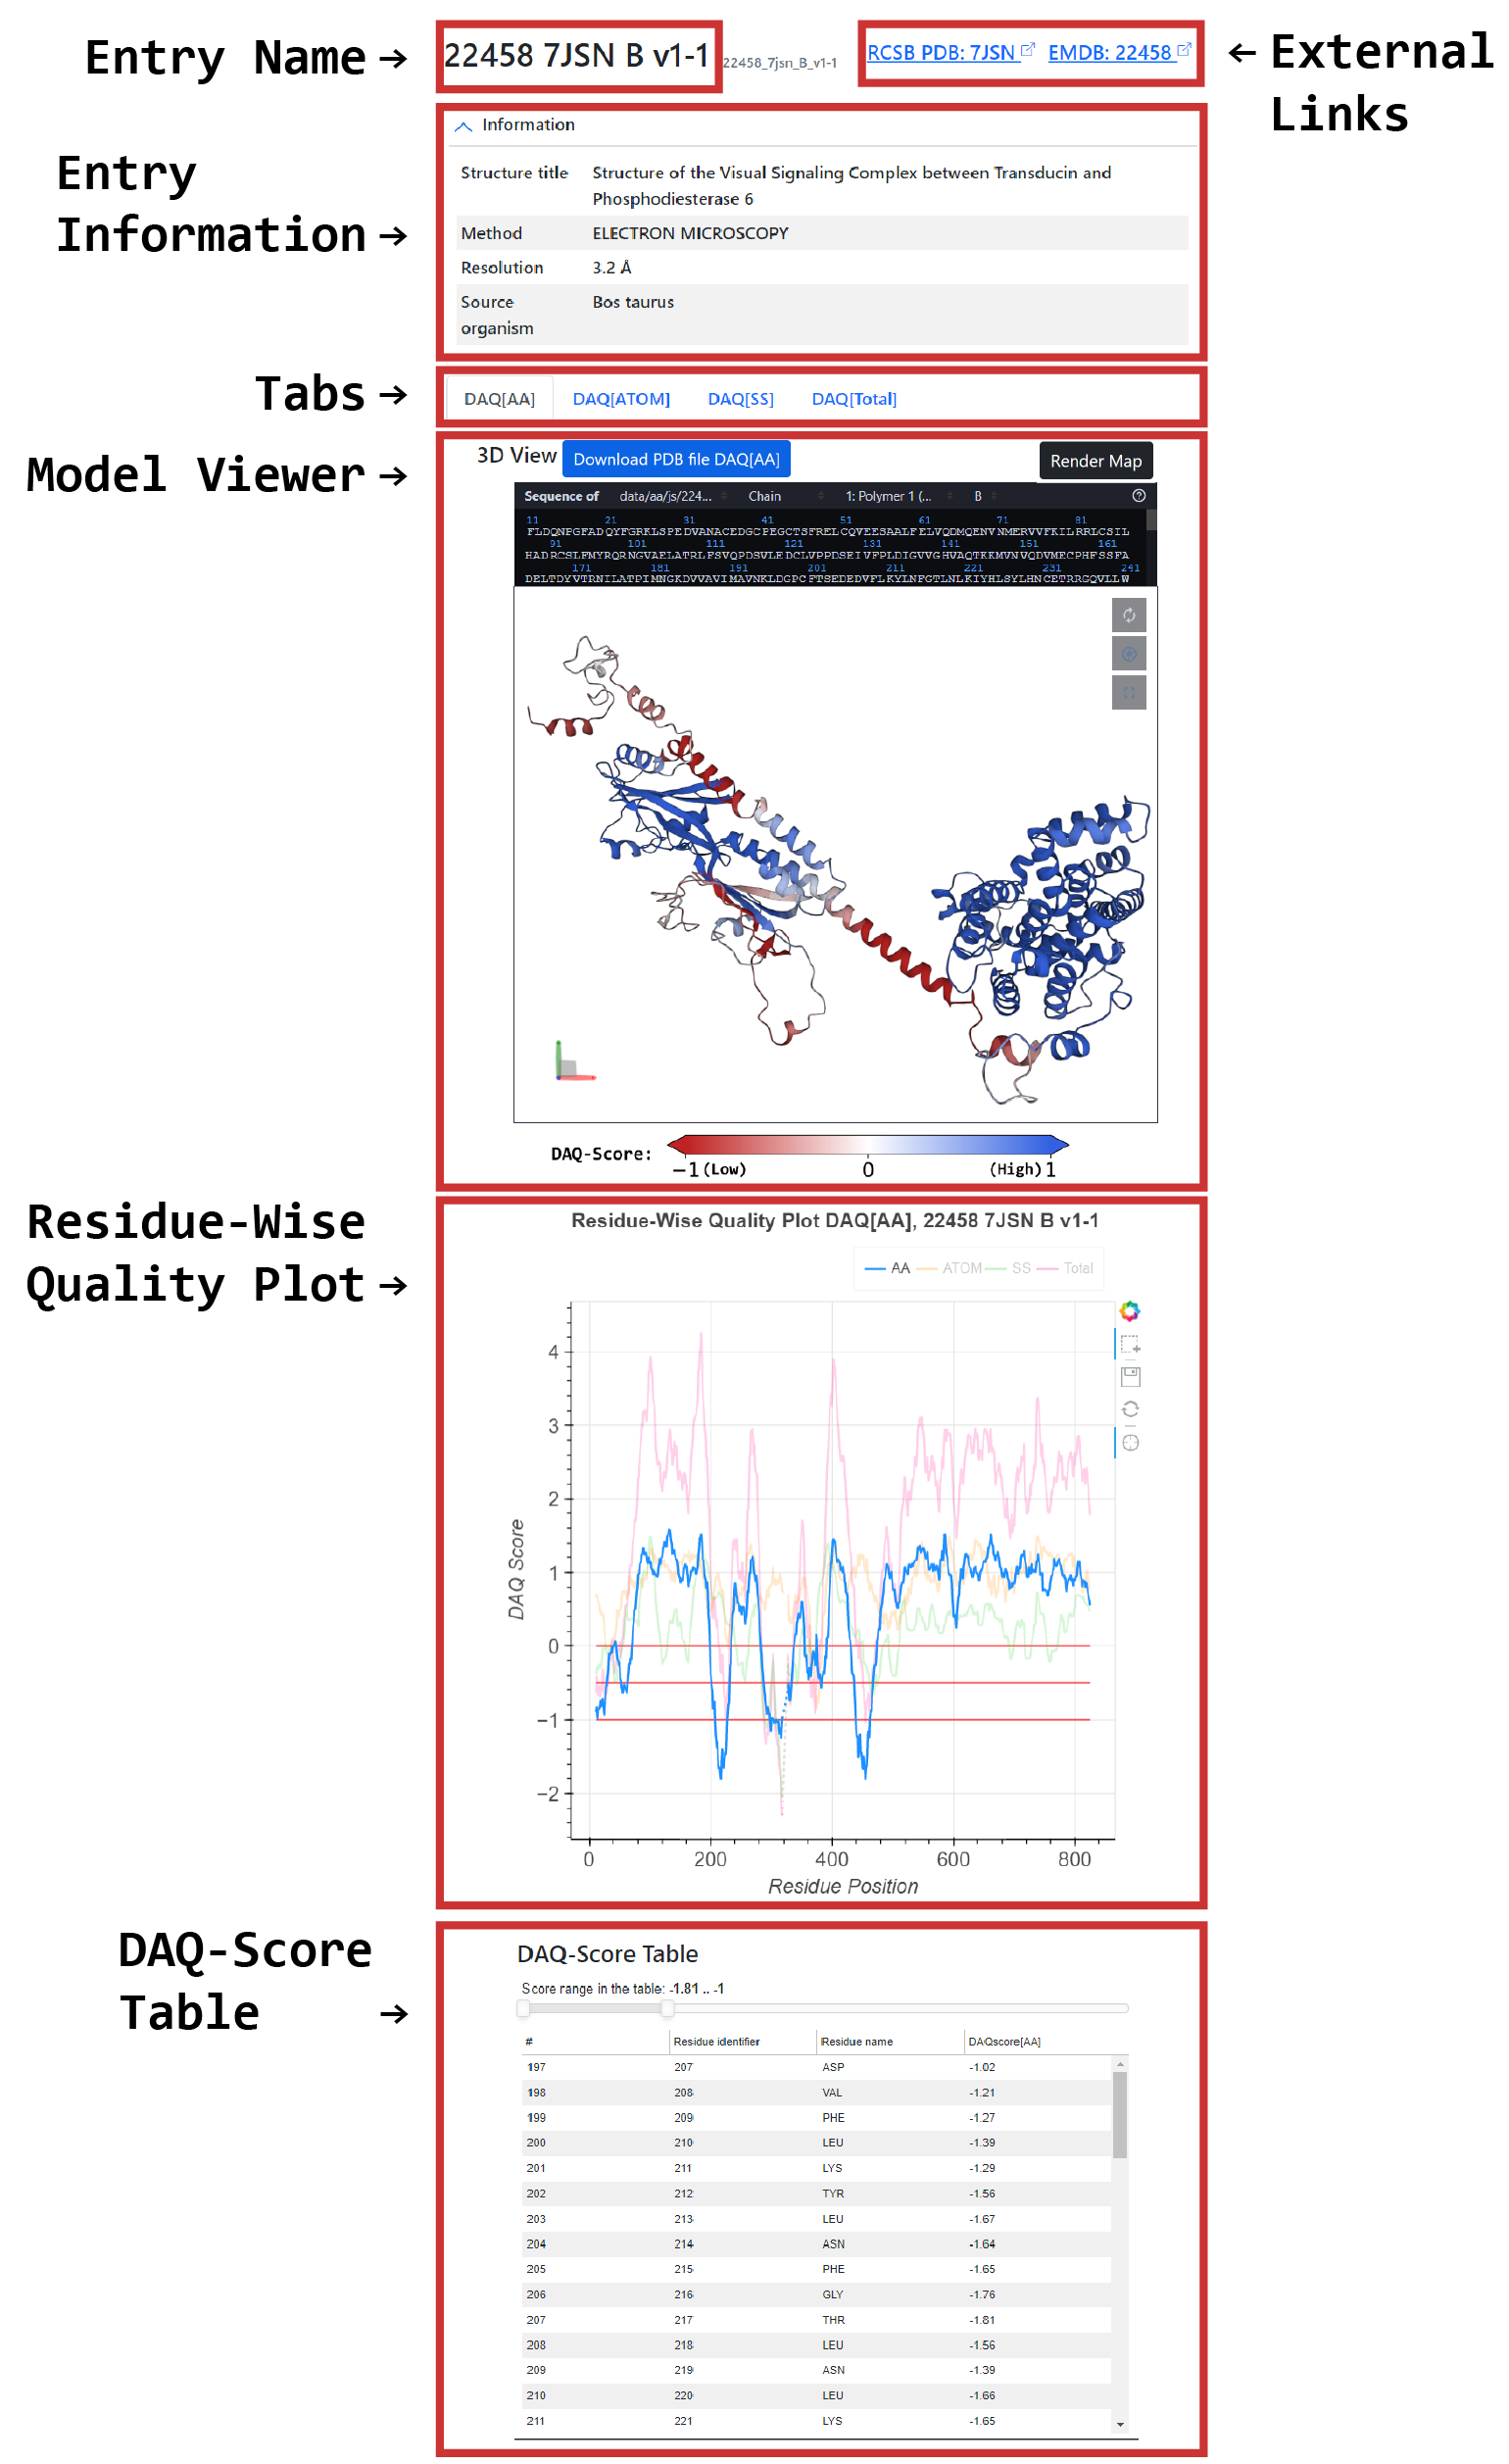
- Entry Name: EMDB ID, PDB ID, author assigned chain ID, major version, and minor version of the PDB model are shown.
Those are concatenated with underscore for Entry ID, which is also used for a part of the URL of the entry.
The scheme is
<EMDB_ID>_<PDB_ID>_<Chain_ID>_v<major_version>-<minor_version>. An entry corresponds to a polymer entity instance in PDB. The detailed information of PDB versioning is available in PDB Versioned Archive of wwPDB. - External Links: Links to RCSB PDB and EMDB webpage corresponding to the entry are shown.
- Entry Information: The entry chain information derived from RCSB PDB is shown. Structure title, Method, and Resolution are the information associated with the PDB Entry. Source organism is the information associated with the PDB polymer entity.
- Tabs: These tabs provide users to change DAQ score types shown in the viewers, graphs and tables.
- AA: Showing DAQ score for amino-acid type.
- Cα: Showing DAQ score for Cα score.
- SS: Showing DAQ score for secondary structure. (When secondary structure prediction cannot be done, this tab is disabled.)
- Total: Showing DAQ scores for the sum of AA, Cα, and SS. (When secondary structure prediction cannot be done, total is the sum of AA and Cα.)
- Model Viewer: The protein structure shown is colored by DAQ score scaled from red (low) to blue (high).
As shown in the color bar below, residues with a DAQ of -1.0 or less are colored in full red and residues with a DAQ of 1.0 or larger are in full blue.
A dashed line in the structure represents missing residues or residues composed of HETATM records.
The interactive visualization tool Mol* is used as the viewer.
The detailed information on how to manipulate the viewer is in Mol* Documentation.
PDB files which include DAQ scores in the temperature factor column are provided through the Download button on top of the Model Viewer. Based on the tab currently selected, which DAQ scores are included is determined. Opening the downloaded pdb file with PyMOL and using the following command in command line of PyMOL,spectrum b, red_white_blue, all, -1,1, DAQ scores can be visualized locally.
Files which include probabilities of predicted secondary structure by SPOT1D are also provided through the Download button in the DAQ[SS] tab. Since DAQ scores for secondary structure rely on results of secondary prediction, users are recommended to check the results of secondary structure prediction also. When the file extension is .spot1d, the file is raw result of SPOT1D. When the file extension is .spd33_spot1df, the file is result of SPIDER3 and it is converted to SPOT1D format.
Clicking the 'Render Map' button displays a map of the protein model in a full structural viewer. - Residue-Wise Quality Plot: The plot shows the currently selected DAQ score type, DAQ[AA], DAQ[Cα], DAQ[SS], or DAQ[Total] which is selected by the tab at the left top of the page.
The default is DAQ[AA].
By clicking a legend(s) of score type(s) at the top of the graph, the corresponding line(s) will change the transparency level.
The X-axis corresponds to the residue identifier, and the Y-axis corresponds to the DAQ score.
Users can select a residue range by dragging the mouse on the graph.
By releasing the mouse button, the selected residues are highlighted in the model viewer.
This feature enables users to interactively grasp where the lower/higher DAQ scores in the graph correspond to positions in the 3D structure.
A dotted line in the plot represents missing residues or residues composed of HETATM records.
The plot shows horizontal red lines on three cutoff values at 0.0, -0.5, and -1.0. A score less than 0.0 indicates that the residue is less fit to the map position than the background average of the amino acid type. Residues with a DAQ(AA) score less than -0.5 are highly likely to be incorrect, and this likelihood increases if the score is less than -1.0. - DAQ Score Table: The currently selected DAQ score type is also shown in this table. By using the slider at the top of the table, the range of DAQ score of residues displayed in the table can be filtered. This feature enables users to know how many residues are in the specific range of DAQ score. By clicking the row in the table, the selected residue is highlighted in the model viewer.
How to run DAQ for new protein models
Please see About page.